

CVSS, EPSS, and KEV: Reading the Three Vulnerability Scores
Contents
Open a list of findings and three indicators sit side by side: CVSS, EPSS, and KEV. Two of them are numeric scores — CVSS and EPSS — while KEV is a record of exploitation that has actually happened.
The same CVE can carry a high CVSS and a low EPSS at once, and that combination is where the meaning is.
The three indicators show different things
CVSS rates technical severity, EPSS estimates the probability of exploitation within the next 30 days, and KEV records that exploitation has actually been observed. They also move differently: a CVSS base score barely shifts once published, while EPSS is recalculated daily.
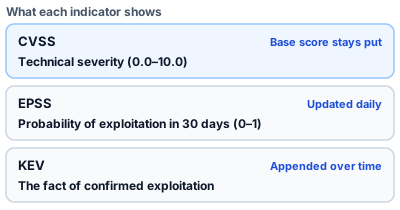
Figure 1: What each indicator shows, and how each one moves
CVSS rates severity, not how likely exploitation is
CVSS (Common Vulnerability Scoring System) rates severity from 0.0 to 10.0 and is maintained by FIRST. It is attached to CVEs broadly, and yet in any given 30-day window only 1.5–3% of published vulnerabilities show exploitation activity (FIRST's own observation). How high the CVSS is does not decide which ones get attacked.
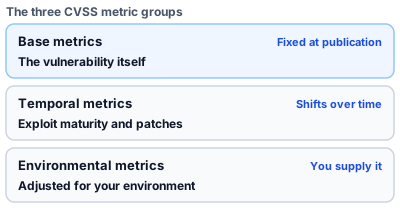
Figure 2: The three CVSS metric groups — what is fixed, what moves, and what you supply
Deep dive: the eight base metrics
Base metrics carry the score, and the specification defines eight of them: attack vector (network or local), attack complexity, privileges required, user interaction, scope, and the impact on confidentiality, integrity, and availability.
Temporal metrics cover exploit code maturity, remediation level, and report confidence; environmental metrics cover the importance of the target system and a re-rating of the base metrics for the organisation. Because the latter two need a judgement from whoever applies them, in practice it is usually the base score alone that circulates.
Cross CVSS with EPSS and four response patterns appear
Severity and exploitation probability are independent, so crossing them yields four patterns. What changes the order of work is not a high CVSS on its own but the combination.
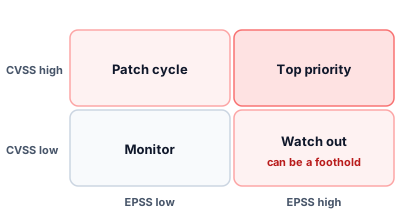
Figure 3: Four patterns from crossing severity with exploitation probability
Deep dive: what gets missed is low severity paired with high exploitation probability
A vulnerability with a low CVSS and a high EPSS sinks toward the bottom of a list sorted by severity. To an attacker it can be foothold enough, so sorting on severity alone is what loses it.
A high CVSS with a low EPSS is the inverse: genuinely severe, but with a weak case for urgency, and it can be handled on the ordinary patch cycle.
KEV is not a prediction — it records exploitation that happened
The KEV (Known Exploited Vulnerabilities) catalog is maintained by CISA in the United States and lists vulnerabilities confirmed as exploited in real attacks. There are more than 370,000 CVEs; only a small fraction of them reach KEV.
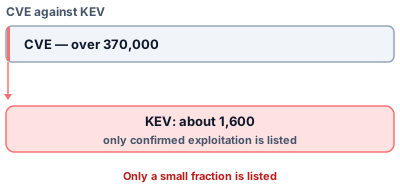
Figure 4: More than 370,000 CVEs, against the vulnerabilities confirmed as exploited
Deep dive: the three criteria for listing
A CVE ID must be assigned; there must be reliable evidence of exploitation in the wild (a proof of concept alone does not qualify); and there must be a clear remediation action. The third is not necessarily a vendor fix — mitigation instructions count, and so does discontinuing use of the product where nothing else is available. Only entries meeting all three are listed.
Each entry carries the affected product, the date added, the remediation deadline for US federal agencies, the required action, and whether the vulnerability is known to be used in ransomware campaigns. A KEV-listed vulnerability in your systems is strong grounds for moving the work forward. The order itself, though, still depends on whether the asset is reachable from outside and how much the business depends on it. Confirmed exploitation also states well to a non-technical audience, which makes it useful evidence in a report.
Scores are the entry point; they do not settle the priority
All three describe the vulnerability itself and say nothing about which of your systems it sits on. The same CVSS 9.0 carries a different real risk on an internet-facing system than on one nothing outside can reach.
PentaTrail/CTEM derives a Threat Discovery Level (TDL) from CVSS and EPSS, raises it a level when the vulnerability is KEV-listed, and combines it with the BI Score for asset importance to place the finding in a TER band (S/A/B/C/D). How the combination works is covered in the TDL article.
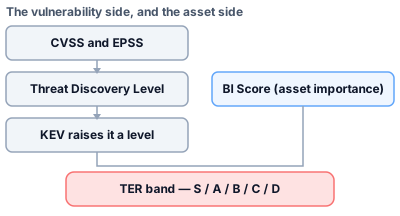
Figure 5: What the scores leave open is closed from the asset side
- Pricing
- What is the Threat Discovery Level (TDL)?
- What is CTEM? A Complete Guide to the 5 Phases
- Discovery Alone Won't Protect You
Seeing which scores land on your own findings takes a 14-day free trial.
Appendix: the bands, and the three compared
Table 2: The three indicators compared
| Indicator | What it measures | Update cadence | Character |
|---|---|---|---|
| CVSS | Technical severity | Base score stays put | Static, no context |
| EPSS | Probability of exploitation | Daily | Predictive, dynamic |
| KEV | The fact of exploitation | Appended as cases appear | Confirmed, most certain |
Table 3: Reading a CVSS score
| Score range | Severity | Typical response |
|---|---|---|
| 9.0-10.0 | Critical | Act immediately |
| 7.0-8.9 | High | Act promptly |
| 4.0-6.9 | Medium | Plan the work |
| 0.1-3.9 | Low | Accepting the risk is reasonable |
The share of vulnerabilities rated Critical has been rising, and treating every one of them with the same urgency is not realistic.
Table 4: Reading an EPSS score
| EPSS score | Chance of observed exploitation within 30 days | Suggested urgency |
|---|---|---|
| 0.9 and above | 90% or more | Act immediately |
| 0.5 to under 0.9 | 50–90% | Urgent |
| 0.1 to under 0.5 | 10–50% | Act early |
| 0.01 to under 0.1 | 1–10% | Plan the work |
| Below 0.01 | Under 1% | Judge on risk |
⚠ The right-hand column is our own guide, not a set of bands defined by FIRST. EPSS alone does not settle the order; decide it together with the asset's importance and its reachability from outside (slide 06).
FIRST publishes a percentile — where a CVE sits among all CVEs — daily, alongside the probability. It shifts with the whole distribution every day, so it is not reproduced here; read it at the time you fetch it.
Table 5: KEV deadlines are set per entry, not by severity
| Days from date added to due date | Entries |
|---|---|
| 21 days | 1,025 |
| 14 days | 260 |
| 181 days | 238 |
| 3 days | 73 |
| 7 days | 20 |
The five most common windows across the 1,665 entries in the published catalog data dated 11 August 2026. CISA sets a deadline per entry for US federal agencies rather than deriving one from CVSS severity. What transfers to a private organisation is not the number of days but the ordering principle: start with what has been confirmed as exploited.
Sources
- The exploitation base rate (1.5–3% in any 30-day window) and how to use EPSS — FIRST, "Using EPSS"
- The definition of EPSS (probability of exploitation within 30 days, recalculated daily) — FIRST, "EPSS"
- The CVSS metric groups and the severity bands — FIRST, "CVSS v3.1 Specification Document"
- The KEV listing criteria and what each entry carries — CISA, "Known Exploited Vulnerabilities Catalog"
- The KEV entry count and the spread of remediation deadlines — the published catalog data, counted by us from the 11 August 2026 edition
- The CVE total and the monthly publication rate — the NVD API, read by us on 14 August 2026
The CVSS description in this article follows version 3.1. KEV held 1,665 entries in the catalog dated 11 August 2026. CVE records total 377,157, and between 7,000 and 10,000 new ones are published each month (read from the NVD API on 14 August 2026; the monthly figures for May, June and July 2026 were 6,985, 8,001 and 9,919).
Visualize your attack surface with PentaTrail CTEM/ASM
From discovery to vulnerability validation and remediation — all powered by the CTEM framework.
Get Started